Pasajeros en la Terminal de Transporte de Bogotá
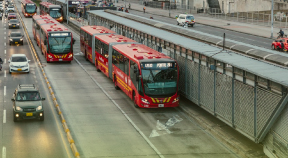
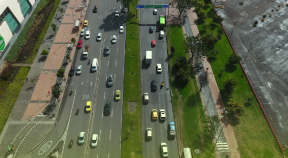
El número de pasajeros en la Terminal de Transporte de Bogotá es un indicador clave para entender la dinámica del transporte intermunicipal en la ciudad. Este dato refleja la cantidad de viajeros que salen diariamente desde la terminal, lo cual permite a las autoridades planificar y mejorar la infraestructura y los servicios de transporte para garantizar desplazamientos más eficientes y seguros. El seguimiento constante de este indicador ayuda a identificar tendencias y tomar decisiones informadas que contribuyan a la movilidad sostenible y la calidad de vida de los ciudadanos.

Fuentes
Periodicidad de actualización
Disponibilidad de los datos
"visualization": "ColumnChart",
"options": {
"title": "",
"titleTextStyle": {
"color": "#000",
"bold": false,
"italic": false,
"fontSize": 14
},
"titlePosition": "",
"colors": [],
"fontName": "Arial",
"fontSize": 12,
"backgroundColor": {
"fill": ""
},
"isStacked": false,
"tooltip": {
"trigger": "none",
"isHtml": false
},
"pieSliceText": "none",
"legend": {
"position": "right",
"alignment": "center",
"title": "",
"titleTextStyle": {
"bold": true,
"italic": false
},
"textStyle": {
"bold": false,
"italic": false
}
},
"interpolateNulls": true,
"animation": {
"duration": 10000,
"easing": "out"
},
"hAxis": {
"title": "Año",
"titleTextStyle": {
"color": "#000",
"bold": false,
"italic": false,
"fontSize": 12
},
"textStyle": {
"color": "#000",
"bold": false,
"italic": false
},
"slantedTextAngle": 0,
"gridlines": {
"color": "#ccc"
},
"baselineColor": "#ccc",
"minorGridlines": {
"color": "#e0e0e0"
},
"viewWindow": {
"min": 0
}
},
"vAxes": [
{
"title": "Millones de pasajeros",
"titleTextStyle": {
"color": "#000",
"bold": false,
"italic": false,
"fontSize": 12
},
"textStyle": {
"color": "#000",
"bold": false,
"italic": false
},
"slantedTextAngle": 0,
"gridlines": {
"color": "#ccc"
},
"baselineColor": "#ccc",
"minorGridlines": {
"color": "#e0e0e0"
},
"viewWindow": {
"min": 0
},
"format": "#"
}
],
"series": [
{
"color": "#bed000",
"pointSize": 0,
"visibleInLegend": true,
"pieSliceText": "none",
"_format": {
"format": "#"
}
}
]
},
"data": [
[
"",
"Número Pasajeros (millones)"
],
[
"2001",
4.760959
],
[
"2002",
4.884828
],
[
"2003",
6.686889
],
[
"2004",
9.216416
],
[
"2005",
9.369527
],
[
"2006",
9.455656
],
[
"2007",
10.280065
],
[
"2008",
9.64089
],
[
"2009",
10.191344
],
[
"2010",
10.36916
],
[
"2011",
10.048615
],
[
"2012",
10.460953
],
[
"2013",
10.04894
],
[
"2014",
10.583627
],
[
"2015",
11.329657
],
[
"2016",
11.130402
],
[
"2017",
14.466775
],
[
"2018",
15.553453
],
[
"2019",
17.226631
],
[
"2020",
6.099869
],
[
"2021",
8.709819
],
[
"2022",
12.537583
],
[
"2023",
15.331177
],
[
"2024",
15.580444
],
[
"2025",
14.848598
]
],
"drupalChartDivElement": {},
"drupalChartDivId": "field_grafica_indicadores_0_config--preview-chart"
}
Definición:
Este indicador permite medir el número de pasajeros despachados por las Terminales de transporte de Bogotá.
Objetivo:
Registrar la cantidad de pasajeros que salen de Bogotá desde la Terminal de Transporte.
Fórmula de Cálculo:
∑ Cantidad de pasajeros que compran tiquetes en las Terminales
Variables:
Número de pasajeros
Unidad de Medida:
Pasajeros
Fuente de Información:
Terminal de Transporte
Entidad Responsable:
Terminal de Transporte
Periodicidad:
Anual
Observaciones Adicionales:
Se realizan ajustes de la información con el sistema al momento de los cierres de cada vigencia.
Chart JSON
{
    "visualization": "ColumnChart",
    "options": {
        "title": "",
        "titleTextStyle": {
            "color": "#000",
            "bold": false,
            "italic": false,
            "fontSize": 14
        },
        "titlePosition": "",
        "colors": [],
        "fontName": "Arial",
        "fontSize": 12,
        "backgroundColor": {
            "fill": ""
        },
        "isStacked": false,
        "tooltip": {
            "trigger": "none",
            "isHtml": false
        },
        "pieSliceText": "none",
        "legend": {
            "position": "right",
            "alignment": "center",
            "title": "",
            "titleTextStyle": {
                "bold": true,
                "italic": false
            },
            "textStyle": {
                "bold": false,
                "italic": false
            }
        },
        "interpolateNulls": true,
        "animation": {
            "duration": 10000,
            "easing": "out"
        },
        "hAxis": {
            "title": "A\u00f1o",
            "titleTextStyle": {
                "color": "#000",
                "bold": false,
                "italic": false,
                "fontSize": 12
            },
            "textStyle": {
                "color": "#000",
                "bold": false,
                "italic": false
            },
            "slantedTextAngle": 0,
            "gridlines": {
                "color": "#ccc"
            },
            "baselineColor": "#ccc",
            "minorGridlines": {
                "color": "#e0e0e0"
            },
            "viewWindow": {
                "min": 0
            }
        },
        "vAxes": [
            {
                "title": "Millones de pasajeros",
                "titleTextStyle": {
                    "color": "#000",
                    "bold": false,
                    "italic": false,
                    "fontSize": 12
                },
                "textStyle": {
                    "color": "#000",
                    "bold": false,
                    "italic": false
                },
                "slantedTextAngle": 0,
                "gridlines": {
                    "color": "#ccc"
                },
                "baselineColor": "#ccc",
                "minorGridlines": {
                    "color": "#e0e0e0"
                },
                "viewWindow": {
                    "min": 0
                },
                "format": "#"
            }
        ],
        "series": [
            {
                "color": "#bed000",
                "pointSize": 0,
                "visibleInLegend": true,
                "pieSliceText": "none",
                "_format": {
                    "format": "#"
                }
            }
        ]
    },
    "data": [
        [
            "",
            "N\u00famero Pasajeros (millones)"
        ],
        [
            "2001",
            4.760959
        ],
        [
            "2002",
            4.884828
        ],
        [
            "2003",
            6.686889
        ],
        [
            "2004",
            9.216416
        ],
        [
            "2005",
            9.369527
        ],
        [
            "2006",
            9.455656
        ],
        [
            "2007",
            10.280065
        ],
        [
            "2008",
            9.64089
        ],
        [
            "2009",
            10.191344
        ],
        [
            "2010",
            10.36916
        ],
        [
            "2011",
            10.048615
        ],
        [
            "2012",
            10.460953
        ],
        [
            "2013",
            10.04894
        ],
        [
            "2014",
            10.583627
        ],
        [
            "2015",
            11.329657
        ],
        [
            "2016",
            11.130402
        ],
        [
            "2017",
            14.466775
        ],
        [
            "2018",
            15.553453
        ],
        [
            "2019",
            17.226631
        ],
        [
            "2020",
            6.099869
        ],
        [
            "2021",
            8.709819
        ],
        [
            "2022",
            12.537583
        ],
        [
            "2023",
            15.331177
        ],
        [
            "2024",
            15.580444
        ],
        [
            "2025",
            14.848598
        ]
    ]
}"visualization": "ColumnChart",
"options": {
"title": "",
"titleTextStyle": {
"color": "#000",
"bold": false,
"italic": false,
"fontSize": 14
},
"titlePosition": "",
"colors": [],
"fontName": "Arial",
"fontSize": 12,
"backgroundColor": {
"fill": ""
},
"isStacked": false,
"tooltip": {
"trigger": "none",
"isHtml": false
},
"pieSliceText": "none",
"legend": {
"position": "right",
"alignment": "center",
"title": "",
"titleTextStyle": {
"bold": true,
"italic": false
},
"textStyle": {
"bold": false,
"italic": false
}
},
"interpolateNulls": true,
"animation": {
"duration": 10000,
"easing": "out"
},
"hAxis": {
"title": "Año",
"titleTextStyle": {
"color": "#000",
"bold": false,
"italic": false,
"fontSize": 12
},
"textStyle": {
"color": "#000",
"bold": false,
"italic": false
},
"slantedTextAngle": 0,
"gridlines": {
"color": "#ccc"
},
"baselineColor": "#ccc",
"minorGridlines": {
"color": "#e0e0e0"
},
"viewWindow": {
"min": 0
}
},
"vAxes": [
{
"title": "Millones de pasajeros",
"titleTextStyle": {
"color": "#000",
"bold": false,
"italic": false,
"fontSize": 12
},
"textStyle": {
"color": "#000",
"bold": false,
"italic": false
},
"slantedTextAngle": 0,
"gridlines": {
"color": "#ccc"
},
"baselineColor": "#ccc",
"minorGridlines": {
"color": "#e0e0e0"
},
"viewWindow": {
"min": 0
},
"format": "#"
}
],
"series": [
{
"color": "#bed000",
"pointSize": 0,
"visibleInLegend": true,
"pieSliceText": "none",
"_format": {
"format": "#"
}
}
]
},
"data": [
[
"",
"Número Pasajeros (millones)"
],
[
"2001",
4.760959
],
[
"2002",
4.884828
],
[
"2003",
6.686889
],
[
"2004",
9.216416
],
[
"2005",
9.369527
],
[
"2006",
9.455656
],
[
"2007",
10.280065
],
[
"2008",
9.64089
],
[
"2009",
10.191344
],
[
"2010",
10.36916
],
[
"2011",
10.048615
],
[
"2012",
10.460953
],
[
"2013",
10.04894
],
[
"2014",
10.583627
],
[
"2015",
11.329657
],
[
"2016",
11.130402
],
[
"2017",
14.466775
],
[
"2018",
15.553453
],
[
"2019",
17.226631
],
[
"2020",
6.099869
],
[
"2021",
8.709819
],
[
"2022",
12.537583
],
[
"2023",
15.331177
],
[
"2024",
15.580444
],
[
"2025",
14.848598
]
],
"drupalChartDivElement": {},
"drupalChartDivId": "field_grafica_indicadores_0_config--preview-chart"
}
Definición:
Este indicador permite medir el número de pasajeros despachados por las Terminales de transporte de Bogotá.
Objetivo:
Registrar la cantidad de pasajeros que salen de Bogotá desde la Terminal de Transporte.
Fórmula de Cálculo:
∑ Cantidad de pasajeros que compran tiquetes en las Terminales
Variables:
Número de pasajeros
Unidad de Medida:
Pasajeros
Fuente de Información:
Terminal de Transporte
Entidad Responsable:
Terminal de Transporte
Periodicidad:
Anual
Observaciones Adicionales:
Se realizan ajustes de la información con el sistema al momento de los cierres de cada vigencia.
Comparte este contenido en tus redes


Otros indicadores que podrían ser de tu interés
Explora nuestros publicaciones sobre movilidad en Bogotá, similares a esta