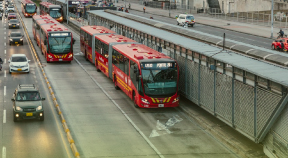
Edad promedio de los vehículos de transporte público según componente
La edad promedio de los vehículos de transporte público en Bogotá es un indicador clave para entender la dinámica de la movilidad en la ciudad. Este dato refleja la antigüedad de la flota del Sistema Integrado de Transporte Público (SITP) y permite tomar decisiones informadas para optimizar vías, mejorar la seguridad y avanzar hacia un transporte más eficiente y sostenible. El seguimiento constante de esta información ayuda a enfocar los esfuerzos en la renovación y mantenimiento de los vehículos que movilizan a millones de bogotanos diariamente.
Fuentes
Periodicidad de actualización
Disponibilidad de los datos
"visualization": "ColumnChart",
"options": {
"title": "",
"titleTextStyle": {
"color": "#000",
"bold": false,
"italic": false,
"fontSize": 14
},
"titlePosition": "",
"colors": [],
"fontName": "Arial",
"fontSize": 12,
"backgroundColor": {
"fill": ""
},
"isStacked": false,
"tooltip": {
"trigger": "none",
"isHtml": false
},
"pieSliceText": "none",
"legend": {
"position": "top",
"alignment": "center",
"title": "",
"titleTextStyle": {
"bold": true,
"italic": false
},
"textStyle": {
"bold": false,
"italic": false
}
},
"interpolateNulls": true,
"animation": {
"duration": 10000,
"easing": "out"
},
"hAxis": {
"title": "Año",
"titleTextStyle": {
"color": "#000",
"bold": false,
"italic": false,
"fontSize": 12
},
"textStyle": {
"color": "#000",
"bold": false,
"italic": false
},
"slantedTextAngle": 0,
"gridlines": {
"color": "#ccc"
},
"baselineColor": "#ccc",
"minorGridlines": {
"color": "#e0e0e0"
},
"viewWindow": {
"min": 0
}
},
"vAxes": [
{
"title": "Edad Promedio",
"titleTextStyle": {
"color": "#000",
"bold": false,
"italic": false,
"fontSize": 12
},
"textStyle": {
"color": "#000",
"bold": false,
"italic": false
},
"slantedTextAngle": 0,
"gridlines": {
"color": "#ccc"
},
"baselineColor": "#ccc",
"minorGridlines": {
"color": "#e0e0e0"
},
"viewWindow": {
"min": 0
},
"format": "#"
}
],
"series": [
{
"color": "#bed000",
"pointSize": 0,
"visibleInLegend": true,
"pieSliceText": "none",
"_format": {
"format": "#"
}
},
{
"color": "#8c9800",
"pointSize": 0,
"visibleInLegend": true,
"pieSliceText": "none",
"_format": {
"format": "#"
}
},
{
"color": "#626b00",
"pointSize": 0,
"visibleInLegend": true,
"pieSliceText": "none",
"_format": {
"format": "#"
}
}
]
},
"data": [
[
"",
"Troncal del SITP",
"Zonal del SITP",
"Alimentación del SITP"
],
[
"2021",
5,
7.1,
4.2
],
[
"2022",
6,
6.7,
5.1
],
[
"2023",
6,
6.2,
5.1
],
[
"2024",
6.5,
7.73,
6.4
],
[
"2025",
7.3,
7.8,
7.9
]
],
"drupalChartDivElement": {},
"drupalChartDivId": "field_grafica_indicadores_0_config--preview-chart"
}
Definición:
Corresponde al promedio de edad de la flota vinculada al Sistema Integrado de Transporte Público SITP.
Objetivo:
Medir la gestión en calidad del servicio por componente, al bajar la edad promedio de la flota (sin incluir taxis), se tendrán mejores condiciones para los usuarios, tanto desde el punto de vista de servicio como de contaminantes emitidos para la ciudad.
Fórmula de Cálculo:
Se calcula haciendo el cociente entre la sumatoría del producto de la cantidad de vehículos por modelo (año) y la edad y, el número de vehículos correspondiente a cada uno de los componentes del SITP relacionados (Alimentador, Zonal y Troncal); según corresponda.
Edad_promedio_componente_y = [(flota_año_x1*edad )+(flota_año_x1 *edad )…..+(flota_año_xn *edad) ]/(# vehículos_componente_y )
Variables:
Información no disponible.
Unidad de Medida:
Años
Fuente de Información:
TRANSMILENIO S.A.
Entidad Responsable:
TRANSMILENIO S.A.
Periodicidad:
Anual
Observaciones Adicionales:
Desde el 2021 por cambio en el operador se miden 3 indicadores de Edad Promedio de los vehículos de transporte Público: Edad promedio de los componentes troncal SITP, zonal SITP, alimentador SITP.
Chart JSON
{
    "visualization": "ColumnChart",
    "options": {
        "title": "",
        "titleTextStyle": {
            "color": "#000",
            "bold": false,
            "italic": false,
            "fontSize": 14
        },
        "titlePosition": "",
        "colors": [],
        "fontName": "Arial",
        "fontSize": 12,
        "backgroundColor": {
            "fill": ""
        },
        "isStacked": false,
        "tooltip": {
            "trigger": "none",
            "isHtml": false
        },
        "pieSliceText": "none",
        "legend": {
            "position": "top",
            "alignment": "center",
            "title": "",
            "titleTextStyle": {
                "bold": true,
                "italic": false
            },
            "textStyle": {
                "bold": false,
                "italic": false
            }
        },
        "interpolateNulls": true,
        "animation": {
            "duration": 10000,
            "easing": "out"
        },
        "hAxis": {
            "title": "A\u00f1o",
            "titleTextStyle": {
                "color": "#000",
                "bold": false,
                "italic": false,
                "fontSize": 12
            },
            "textStyle": {
                "color": "#000",
                "bold": false,
                "italic": false
            },
            "slantedTextAngle": 0,
            "gridlines": {
                "color": "#ccc"
            },
            "baselineColor": "#ccc",
            "minorGridlines": {
                "color": "#e0e0e0"
            },
            "viewWindow": {
                "min": 0
            }
        },
        "vAxes": [
            {
                "title": "Edad Promedio",
                "titleTextStyle": {
                    "color": "#000",
                    "bold": false,
                    "italic": false,
                    "fontSize": 12
                },
                "textStyle": {
                    "color": "#000",
                    "bold": false,
                    "italic": false
                },
                "slantedTextAngle": 0,
                "gridlines": {
                    "color": "#ccc"
                },
                "baselineColor": "#ccc",
                "minorGridlines": {
                    "color": "#e0e0e0"
                },
                "viewWindow": {
                    "min": 0
                },
                "format": "#"
            }
        ],
        "series": [
            {
                "color": "#bed000",
                "pointSize": 0,
                "visibleInLegend": true,
                "pieSliceText": "none",
                "_format": {
                    "format": "#"
                }
            },
            {
                "color": "#8c9800",
                "pointSize": 0,
                "visibleInLegend": true,
                "pieSliceText": "none",
                "_format": {
                    "format": "#"
                }
            },
            {
                "color": "#626b00",
                "pointSize": 0,
                "visibleInLegend": true,
                "pieSliceText": "none",
                "_format": {
                    "format": "#"
                }
            }
        ]
    },
    "data": [
        [
            "",
            "Troncal del SITP",
            "Zonal del SITP",
            "Alimentaci\u00f3n del SITP"
        ],
        [
            "2021",
            5,
            7.1,
            4.2
        ],
        [
            "2022",
            6,
            6.7,
            5.1
        ],
        [
            "2023",
            6,
            6.2,
            5.1
        ],
        [
            "2024",
            6.5,
            7.73,
            6.4
        ],
        [
            "2025",
            7.3,
            7.8,
            7.9
        ]
    ]
}"visualization": "ColumnChart",
"options": {
"title": "",
"titleTextStyle": {
"color": "#000",
"bold": false,
"italic": false,
"fontSize": 14
},
"titlePosition": "",
"colors": [],
"fontName": "Arial",
"fontSize": 12,
"backgroundColor": {
"fill": ""
},
"isStacked": false,
"tooltip": {
"trigger": "none",
"isHtml": false
},
"pieSliceText": "none",
"legend": {
"position": "top",
"alignment": "center",
"title": "",
"titleTextStyle": {
"bold": true,
"italic": false
},
"textStyle": {
"bold": false,
"italic": false
}
},
"interpolateNulls": true,
"animation": {
"duration": 10000,
"easing": "out"
},
"hAxis": {
"title": "Año",
"titleTextStyle": {
"color": "#000",
"bold": false,
"italic": false,
"fontSize": 12
},
"textStyle": {
"color": "#000",
"bold": false,
"italic": false
},
"slantedTextAngle": 0,
"gridlines": {
"color": "#ccc"
},
"baselineColor": "#ccc",
"minorGridlines": {
"color": "#e0e0e0"
},
"viewWindow": {
"min": 0
}
},
"vAxes": [
{
"title": "Edad Promedio",
"titleTextStyle": {
"color": "#000",
"bold": false,
"italic": false,
"fontSize": 12
},
"textStyle": {
"color": "#000",
"bold": false,
"italic": false
},
"slantedTextAngle": 0,
"gridlines": {
"color": "#ccc"
},
"baselineColor": "#ccc",
"minorGridlines": {
"color": "#e0e0e0"
},
"viewWindow": {
"min": 0
},
"format": "#"
}
],
"series": [
{
"color": "#bed000",
"pointSize": 0,
"visibleInLegend": true,
"pieSliceText": "none",
"_format": {
"format": "#"
}
},
{
"color": "#8c9800",
"pointSize": 0,
"visibleInLegend": true,
"pieSliceText": "none",
"_format": {
"format": "#"
}
},
{
"color": "#626b00",
"pointSize": 0,
"visibleInLegend": true,
"pieSliceText": "none",
"_format": {
"format": "#"
}
}
]
},
"data": [
[
"",
"Troncal del SITP",
"Zonal del SITP",
"Alimentación del SITP"
],
[
"2021",
5,
7.1,
4.2
],
[
"2022",
6,
6.7,
5.1
],
[
"2023",
6,
6.2,
5.1
],
[
"2024",
6.5,
7.73,
6.4
],
[
"2025",
7.3,
7.8,
7.9
]
],
"drupalChartDivElement": {},
"drupalChartDivId": "field_grafica_indicadores_0_config--preview-chart"
}
Definición:
Corresponde al promedio de edad de la flota vinculada al Sistema Integrado de Transporte Público SITP.
Objetivo:
Medir la gestión en calidad del servicio por componente, al bajar la edad promedio de la flota (sin incluir taxis), se tendrán mejores condiciones para los usuarios, tanto desde el punto de vista de servicio como de contaminantes emitidos para la ciudad.
Fórmula de Cálculo:
Se calcula haciendo el cociente entre la sumatoría del producto de la cantidad de vehículos por modelo (año) y la edad y, el número de vehículos correspondiente a cada uno de los componentes del SITP relacionados (Alimentador, Zonal y Troncal); según corresponda.
Edad_promedio_componente_y = [(flota_año_x1*edad )+(flota_año_x1 *edad )…..+(flota_año_xn *edad) ]/(# vehículos_componente_y )
Variables:
Información no disponible.
Unidad de Medida:
Años
Fuente de Información:
TRANSMILENIO S.A.
Entidad Responsable:
TRANSMILENIO S.A.
Periodicidad:
Anual
Observaciones Adicionales:
Desde el 2021 por cambio en el operador se miden 3 indicadores de Edad Promedio de los vehículos de transporte Público: Edad promedio de los componentes troncal SITP, zonal SITP, alimentador SITP.
Comparte este contenido en tus redes


Otros indicadores que podrían ser de tu interés
Explora nuestros publicaciones sobre movilidad en Bogotá, similares a esta